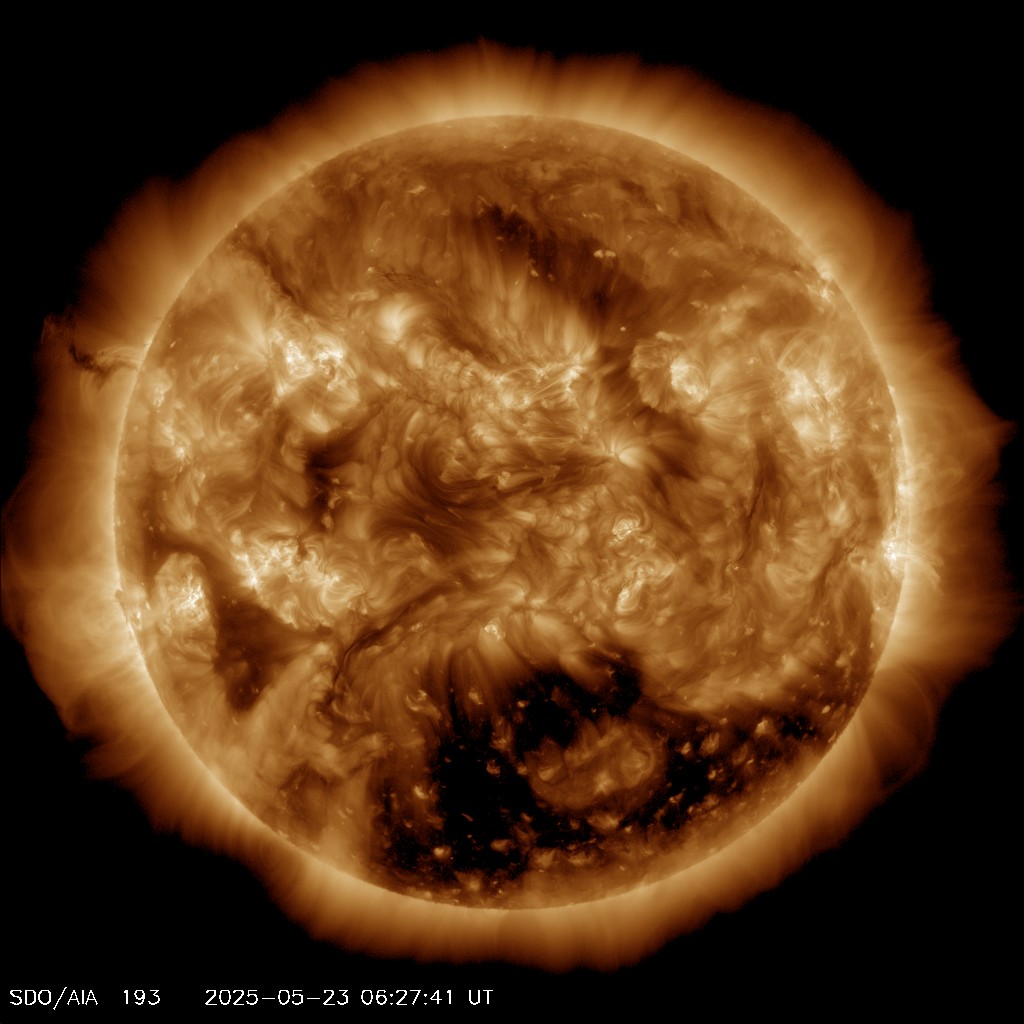
Die Aktivität der Sonne ändert sich dramatisch im Laufe des Sonnenzyklus, der ungefähr 11 Jahre dauert. Die wissenschaftlichen Ziele der Gruppe Sonnenphysik sind die Untersuchung von Aktivitäten zu unterschiedlichen Zeiten und Größenordnungen, wie sie beispielsweise im täglichen Bild der Sonne in Abbildung 1 des Solar Dynamics Observatory (SDO) zu sehen sind.
Introduction
The Sun’s activity changes dramatically over the solar cycle which lasts roughly 11 years. The scientific goals of the Solar Physics group are to research solar activity at different time and size-scales, as seen for instance in the daily image of the Sun in Figure 1 from the Solar Dynamics Observatory (SDO).
The key science questions are:
- What are the physical processes that create and drive the solar wind?
- What triggers and drives solar flares and coronal mass ejections?
These questions are highly aligned with the ESA Solar Orbiter mission science goals. Prof. Harra is a co-PI on the Solar Orbiter EUI and SPICE instruments. The Solar Orbiter science goals are detailed in the science activity plan and can be downloaded here.
Figure 1. Daily image from the Solar Dynamics Observatory (SDO) AIA instrument with a Fe-XII 193Å filter. The Sun changes on all time-scales – from minutes to years. We are interested in the processes that happen on short time-scales such as jets and flares, and how those vary and change over the solar cycle.
Research
1) What are the physical processes that create and drive the solar wind?
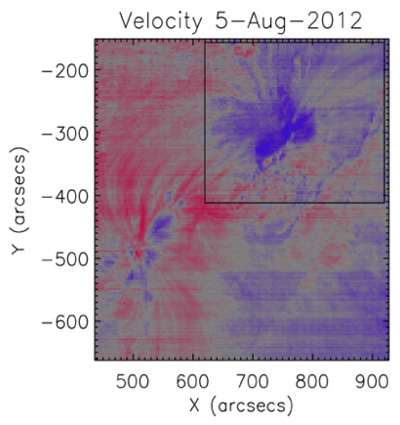
The solar wind is categorised into two components – the slow and highly variable wind emanating from the activity belt, and the fast and steady wind emanating from the coronal holes. The slow solar wind has multiple potential origins. One is that coming from the edges of active regions as shown in Figure 2. These upflow regions have been consistently found at the edge of active regions with the Ultraviolet Imaging Spectrometer (EIS) onboard the Hinode satellite. Combined modelling work has shown that plasma from some but not all of these regions can escape into the solar wind.
Combining these measurements with in-situ measurements of the slow solar wind have found consistency in the abundance measurements. Hinode EIS has a solar cycle’s worth of data that can be explored. The Solar Orbiter mission will specifically address the solar wind location by using a combination of remote sensing and in-situ instruments to explore the solar wind at close quarters.
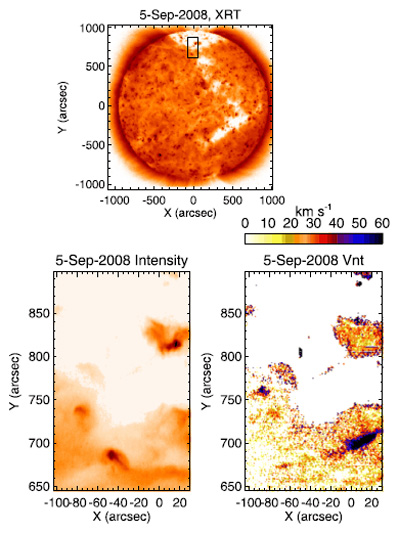
The fast-solar wind is a second aspect. Coronal holes are relatively “dark” in the corona – hence their name. However, they are filled with activity such as jets. Jets are seen in intensity variations in imaging data, but can also be seen in spectroscopic data through measurement of Doppler velocities and non-thermal velocities. The spectroscopic data allows exploration of events that are not associated with strong intensity variations (see Figure 3).
Prof. Louise Harra is a team leader of an ISSI international team with the title: “Exploring The Solar Wind In Regions Closer Than Ever Observed Before”. This team is exploring data from both the Hinode and IRIS spacecrafts alongside the first perihelion data from the Parker Solar Probe mission. This team will be preparing for observations from Solar Orbiter.
2) What triggers and drives solar flares and coronal mass ejections?
This topic is exploring the early stages of large energy release in the Sun. In particular this research is exploring spectroscopic changes that happen early in the build-up to a flare. One way to do this is measuring the emission line profiles and determining the non-thermal velocity. This has been seen to increase before the flare intensity increases significantly.
We can spatially resolve the locations now, and in flares that become eruptive it was found that these locations lie where the magnetic flux starts to erupt. As well as the emission line profiles, the “overlappogram” data from the wide slot on Hinode can also be used.
The benefit of the wide slot data is that it images the whole active region at high time cadence. Harra et al. (2017) demonstrate that red-shifted plasma in He-II was found where the energy deposition was, and the filament eruption was also seen in blue-shifted plasma. There are extensive datasets for this type of data that have as yet not been probed.
3. What is the role of the small-scale structures in solar wind generation?
The solar atmosphere is built of numerous types of structures with a large range of sizes from 1000 km small-scale loops to prominences of 800,000 km radius which are comparable to solar radius. The atmospheric structures present a large diversity in lifetime from minutes to several days or even weeks. The high-resolution observation of the Sun obtained by the space-based missions, Hinode, Solar Dynamics Observatory (SDO), Interface Region Imaging Spectrograph (IRIS), and the sounding rocket High-Resolution Coronal Imager (Hi-C), uncover a rich zoo of small-scale structures. These structures have descriptive names such as miniature coronal loops, small transition region loops, flashing loops, short low-lying loops, unresolved fine structure loops (UFS), EUV bright dots, and penumbral bright dots. They full-field the solar atmosphere from the photosphere through the chromosphere and transition region to the corona. Despite their small size (~10,000 km), they are numerous in the solar atmosphere. Hence, they can significantly impact the physics of the solar atmosphere and creation of the solar wind. This is naturally going to be one of the long-standing questions of solar physics – what is the role of the small-scale structures in the generation of solar wind?
The new high-resolution mission, Solar Orbiter, allows us to investigate the small-scale structures with unprecedented spatial and temporal resolution. Moreover, first observations from Solar Orbiter show never seen before small-scale features called ‘camp-fires’. The physics of the ‘camp-fires’ and many other small-scale structures is still unknown. We are investigating these structures to understand their impact on the solar atmosphere, especially their relationship with the solar wind.
Figure 2. Doppler velocity map of an active region on the Sun observed by the Hinode-EIS instrument. Blue and red colours indicate blue and red-shifted plasma, respectively (Harra et al., 2017).

Figure 3. Image showing spectroscopic data from a polar coronal hole. On the bottom left is intensity and the bottom right is non-thermal velocity. A feature can clearly be seen in non-thermal velocity but not in intensity.


