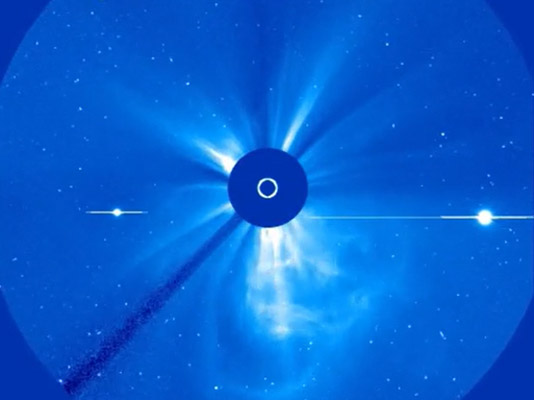
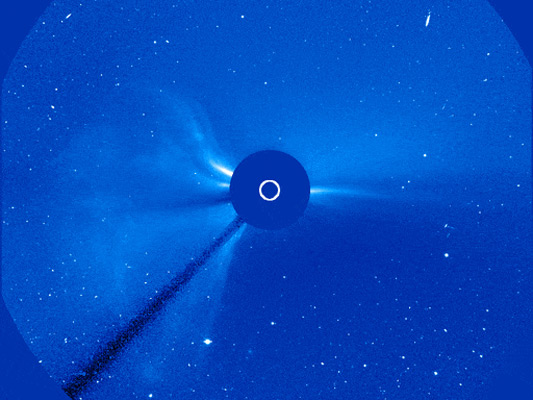
SOHO’s view of the 11 May 2024 solar storm
Over the weekend of 10–12 May 2024, Earth was struck by the largest solar storm in more than a decade.
ESA, 15 May 2024


Over the weekend of 10–12 May 2024, Earth was struck by the largest solar storm in more than a decade.
ESA, 15 May 2024
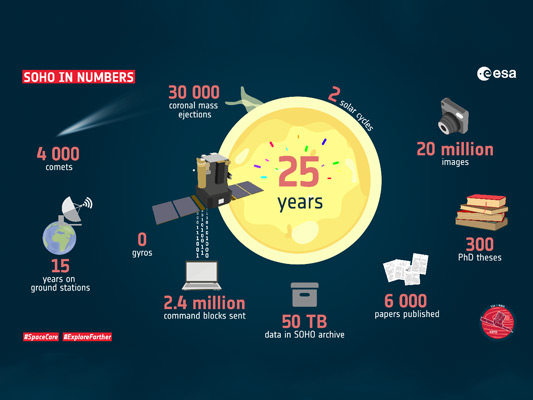
The ESA-NASA Solar and Heliospheric Observatory (SOHO) is celebrating its twenty-fifth launch anniversary.
ESA, 2 Dec. 2020
The Sun started SOHO’s 25th anniversary celebrations early, unleashing a coronal mass ejection – a large release of plasma and magnetic fields – on 29 November . . .
ESA, 2 Dec. 2020
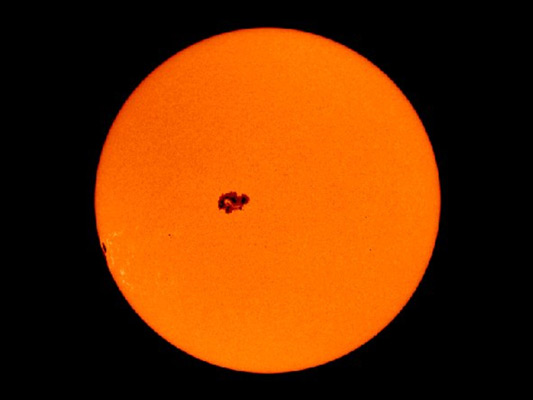
The Sun has entered its 25th solar cycle and is about to wake up. For the last few years our star has been pretty sleepy . . .
ESA, 29 Oct. 2020
ESA SOHO main website
ESA SOHO overview
NASA SOHO main website
NASA SOHO science archives
Institut d’Astrophysique Spatiale (IPS) Archived VIRGO homepage
Royal Meteorological Institute of Belgium (RMI) DIARAD/VIRGO homepage
Max Planck Institut für Sonnensystemforschung (MPS) SOHO homepage
eoPortal
SOHO (SOlar Heliospheric Observatory) is designed to study the internal structure of the Sun, its extensive outer atmosphere and the origin of the solar wind, the stream of highly ionised gas that blows continuously outward through the Solar System. SOHO is a space-based observatory, viewing and investigating the Sun from its deep core, through its outer atmosphere – the corona – and the domain of the solar wind, out to a distance ten times beyond the Earth’s orbit.
SOHO is designed to study the internal structure of the Sun, its extensive outer atmosphere and the origin of the solar wind, the stream of highly ionized gas that blows continuously outward through the Solar System.
SOHO is helping us understand the interactions between the Sun and the Earth’s environment better than has been possible to date. Its legacy may enable scientists to solve some of the most perplexing riddles about the Sun, including the heating of the solar corona, the acceleration of the solar wind, and the physical conditions of the solar interior. It gives solar physicists their first long term and uninterrupted view of the Sun. This opposed to all previous solar observatories that were placed in an orbit around Earth from where their observations were periodically interrupted as our planet ‘eclipsed’ the Sun.
SOHO is a three-axis stabilised spacecraft. It is made up of two modules: the Service Module that provides power, control, pointing and telecommunications for the whole spacecraft and support for the solar panels, and the Payload Module that houses all the scientific instruments.
The instruments onboard SOHO are:
SOHO is operated from a permanent vantage point 1.5 million km sunward of the Earth in a halo orbit around the first Lagrangian point.
SOHO is commanded from NASA’s Goddard Space Flight Center (GSFC) in Greenbelt, Maryland (USA). Its data are retrieved via the NASA Deep Space Network (DSN).
Source and credits: ESA SOHO website
The scientific objective of the VIRGO instrument (Variability of solar IRradiance and Gravity Oscillations) is to determine the characteristics of pressure and internal gravity oscillations by observing irradiance and radiance variations, to measure the solar total and spectral irradiance and to quantify their variability over periods of days to the duration of the mission. With these data helioseismological methods can be used to probe the solar interior.
The VIRGO instrument on the ESA/NASA SOHO Mission has three types of instruments to measure total solar irradiance (TSI) with the absolute radiometers DIARAD and PMO6V, spectral solar irradiance at 402, 500 and 862 nm with a 3-channel sun photometer (SPM) and spectral radiance at 500 nm with a Luminosity Oscillation Imager (LOI).
The optical system of the VIRGO assembly consists of a Ritchey-Chrétien type telescope with a 1300 mm focal length, diameter of 55 mm, and central obstruction 25 mm. The detector is a deep diffused silicon photodiode with 12 scientific and four guiding pixels.
The Total Solar Irradiance (TSI) is being observed with active cavity radiometers (PMO6 and DIARAD) which are traceable to the SI scale of irradiance through direct comparison with cryogenic radiometers on the ground and in vacuum for the PMO6, and thorough characterization in the laboratory for the DIARAD. SSI (Spectral Solar Irradiance) measurements are carried out by SPM (Sunphotometers).
VIRGO provides:
These data will be used to achieve the main scientific objectives of VIRGO, summarised in the following list:
All VIRGO data are sent after reception on ground to the VIRGO Data Center which is operated by and located at the Instituto Astrofisica de Canarias in La Laguna on Tenerife. After reception the raw data are separated into instrument files forming the level-0 data sets organised in daily files. During this process possible gaps in the science data due to transmission problems are filled from the 12 and 24-hour delayed data packets, which are stored onboard and transmitted together with real-time packets.
Level-1 data are those that have been converted to physical units; they include the calibrations and contain all the corrections known a priori for instrument-related effects, such as the influence of temperature variation. The signals are also reduced to 1 AU distance and to zero radial velocity. The processing is based on the algorithms developed and maintained by the CoI responsible for the instrument concerned (Instrument CoIs: T. Appourchaux for LOI, S. Dewitte (D. Crommelynck until 1998) for DIARAD, W. Finsterle (J. Romero, M. Anklin and I. Ruedi until 1996, 1999, and 200x, respectively) for PMO6V and for SPM (C. Wehrli until 2015). These level-1 data are publically available in the SOHO archive and are still raw in the sense that they do not contain corrections for, e.g. degradation, which can be calculated only from a posteriori analysis.
In a next step, corrections for the degradation of radiometers (or exposure- dependent changes) have to be determined. The degradation of radiometers onboard satellites, due to UV/EUV radiation, has been the subject of in-depth research. Several methods for its correction have been proposed (Fröhlich, 2003; Fröhlich and Since, 2006). Each of the data sets listed above consist of the TSI measurements from an active (continuously operated) and at least one back-up (occasionally operated) channel. The instrument degradation is then assessed by comparing the measurements of the active channel to the occasionally operated back-up channel(s). The exact procedure is a matter of personal judgement by the instrument team and often evolves over the lifetime of each experiment. Correction of degradation is particularly important when comparing and/or combining TSI measurements from different missions into a single composite time-series.
For the SPM data, a similar procedure for the correction of degradation is not possible, mainly because these instruments have much larger overall changes and the results from the rarely exposed back-up SPM do not provide a reliable source for the assessment of the long-term changes. Nevertheless, the time-series can be detrended and allow periods of up to 1 year to be assessed. These data are labelled as level-2 (described further below) and are are available via:
Astromat open archive website →
ftp://ftp.pmodwrc.ch/pub/data/irradiance/virgo/TSI/
ftp://ftp.pmodwrc.ch/pub/data/irradiance/virgo/SSI/
Note: Several browsers no longer allow ftp addresses to be directly accessed via a link. If you have problems accessing our ftp server, please use an FTP app or try the Astromat website.
The level-1 data are organised in daily FITS files with the data in ASCII extensions. The data and format are described in the corresponding headers. As it is a standard FITS format, the files can be read with the FITS library for the programming language you use. An example of the FITS headers for SPM, DIARAD, PMO6V and LOI files on 1 January 2003 can be retrieved in the file FITS_Headers.txt from our ftp server, where there is also a collection of IDL routines to read the VIRGO daily FITS files.
The SPM, PMO6V and LOI data are 1-min samples (1440 values per day) and the DIARAD data 3-min. samples (480 values per day). As MDI and GOLF, VIRGO should have had its 1-min values centered at 00:00:00 TAI. However, early in the mission, the midnight pulse which is used by VIRGO for synchronzation of the timing-chain, was set to 00:00:00 UTC instead of TAI, which yields a delay of 32 seconds (the sum of leap seconds since the start of TAI). Thus the 1-min averages of SPM and LOI data are centered at 32s after the TAI minute (first measurement @ 00:00:32 TAI). The 20s averages of PMO6V data every minute are centered at 22s after the TAI minute (first measurement @ 00:00:18 TAI), and the 10s averages of DIARAD data every 3 minutes at 87 s after the start of a 3-min. period (first measurement @ 00:00:87 TAI).
The following information is retrieved from the data files using IDL routines:
The level-1 data products are normally updated on a weekly basis and transferred from VDC to the SOHO archive, from where they can be downloaded.
The level 2 TSI time-series for VIRGO, PMO6V are available as minute, hourly and daily values (Astromat website; or ftp://ftp.pmodwrc.ch/pub/data/irradiance/virgo/TSI). Various products have been released since the beginning of the mission. Until v7 released in 2018, the algorithm was designed and modified over the years to include various assumptions by the late Dr. Claus Fröhlich. His description is still available in the VIRGO data products archived webpage.
The new version v8 is now performed by a machine-learning and data fusion algorithm (Finsterle et al., 2021). For a detailed description of the evaluation see VIRGO Radiometry below. Figure 1 displays the new version (v8) and the previous versions v6 and v7.
The level-2 SPM data are at the moment not available due to the detection of non-linear degradation effects from the filters described by Wehrli et al. (2013). We are working on how to mitigate such issues. Note that the previous products (1996-2008) are still available in the VIRGO data products archived webpage.
The VIRGO instrument has two types of radiometers to measure TSI: DIARAD and PMO6V. The former was developed and built by IRMB, the latter by PMOD/WRC. For the VIRGO radiometers, detailed descriptions of the principle and performance can be found in Fröhlich et al. (1995), and Fröhlich et al. (1997). The scientific objective of VIRGO, as stated in the original proposal and in Fröhlich et al. (1995), is to provide a reliable TSI time-series, which takes full advantage of both types of radiometers and their backup. This final product, the data level-2, includes corrections for changes due to exposure to the Sun and other effects. Note that the DIARAD dataset (level-2) is available from Dr. S. Dewitte by request.
The analysis of the data up to level-2 is described in some detail by Finsterle et al. (2021) and summarised below.
The raw data (level-0), as transmitted from the spacecraft to ground, are transformed into physical units using the radiometric factor which is determined for each individual radiometer by characterisation experiments in the laboratory. Furthermore, corrections for all a-priori known effects, are applied such as temperature, distance and radial velocity to the Sun. These data are labelled level-1. The algorithms for the calculation of level-1 data were developed by PMOD/WRC for the PMO6V radiometers. The original algorithms are described in Fröhlich et al. (1997) which are still being updated to cope with changes in operation and with the better understanding of their performance. Figure 2 shows the result for the present version, updated to YYMM, the date in the filename. These time-series obviously do not show the variations of the solar irradiance alone, but also changes of the radiometric sensitivity.
The early behaviour of PMO6V is characterised by a rapid increase which is the result of a rapid darkening of the precision aperture surface which reduces the amount of stray-light from the baffle. The darkening is known since the apertures of the retrieved SOVA radiometer of the EURECA mission were inspected but the early increase was thought to be due to a change of the aperture heating. This, however, cannot explain the effect. Stray-light and IR radiation from the heated baffle back to the cavity is of the order of more than 3000 ppm which could explain the early increase and also the high absolute values of TSI relative to TIM on SORCE. This effect is observed in most radiometers with a classical arrangement of the precision and view-limiting apertures, such as HF, ERBS and ACRIMs, and so also their high absolute values.
The new evaluation is no longer based on the straightforward correction of the PMO6V by the backup, because PMO6V-B needs to be corrected for its early increase before it can be used to correct PMO6V-A. There have been different algorithms developed over the past decades to do such corrections, giving various datasets (e.g. PMO6-v6, PMO6-v7). It is an open debate about some inconsistencies in these previous products due to different assumptions often using personal judgement when processing the data. A full description is still available in the VIRGO data products archived webpage. Since 2021, we are now using a machine-learning and data fusion algorithm (Finsterle et al., 2021) to process the TSI observations without filtering or applying any sort of data pre-processing which can be classified as “human refinement”. This should therefore improve the consistency between future releases.
Step 1: Degradation Correction using Machine-Learning
The machine-learning algorithm is based on three hypotheses to perform the degradation correction of the main channel. Our first assumption is that degradation is a function of exposure time only. The exposure time is estimated via a cumulative sum of the measurements recorded by each channel (PMO6V-A and PMO6V-B). The degradation function has been comprehensively studied by Remesal Oliva (2021).
Since the back-up instruments/channels (PMO6V-B) have lower observation rates (and hence exposure times) than the active instruments/channels (PMO6V-A), they degrade less rapidly. Our second assumption is that all instruments and channels start with no degradation and the third assumption is that the degradation curve monotonically decreases. The reader can find the algorithm in Finsterle et al. (2021). Figure 3 shows the ratio of the raw measurements PMO6V-A and PMO6V-B as a function of time (days).
Figure 3. Ratio of PMO6V-A and PMO6V-B raw measurements as a function of time. The red curve is the degradation correction function. Note that the early-increase was corrected manually before running the degradation correction algorithm. The degradation curve thus only starts after the early-increasing phase of PMO6V-A.
Step 2: Data Fusion
The second step is the data fusion. It aims at merging the corrected observations from the two channels in order to get a reliable estimate of the true signal s, knowing that the underlying process model of s is random and unknown. Therefore, we formulate two assumptions:
It is important to emphasise that the training of kα with the so-called “inducing points”” is to learn about the stochastic properties of the data, which allows to take short-term correlations in the observations to be taken into account, and a reasonable approximation of s. Thus, our simulations use 5000 inducing points which is a trade-off between modelling all the processes well, and avoiding long computing time (i.e. no more than 48 hrs) with a regular desktop computer (i.e. 16 Gb RAM, 4 cores). Note that the final time-series has an hourly rate in order to avoid a large data set (i.e. > 100 Mb).
We estimate the empirical cycle-to-cycle stability of our new degradation algorithm by comparing the VIRGO TSI composite to the independent data set from SORCE/TIM. Figure 4 shows the degradation corrected PMO6V-A (blue) and the PMO6V composite (PMO6V-A + PMO6V-B, green). For comparison we also show the SORCE/TIM and TSIS/TIM time-series. In 2008/09, VIRGO reads 0.27 W.m-2 higher than SORCE/TIM, in 2019/20, VIRGO reads 0.01 W.m-2 lower than SORCE/TIM, resulting in a relative trend of −0.28 W.m-2 of VIRGO with respect to SORCE/TIM.
We take this trend as the empirical uncertainty of the long-term stability of the machine-learning and data fusion algorithm. Together with the empirical standard deviations of both time-series (i.e. 0.04 W.m-2 for SORCE/TIM and 0.05 W.m-2 for the VIRGO composite) the resulting uncertainty is (0.282 + 0.042 + 0.02)0.5 = 0.29. From the VIRGO TSI composite, we thus find a non-significant minimum-to-minimum variation between 2008/2009 and 2019/2020 of −0.17 ± 0.29 W.m-2.
Since the advent of the results of TIM on SORCE it became clear that classical radiometers may have a problem with the absolute scale. From the beginning it was suspected that it may have to do with the relative arrangement of the precision and view-limiting apertures. Classical radiometers have the precision aperture directly in front of the cavity whereas the new generation of radiometers, such as TIM, have it at the very entrance of the radiometer and use the cavity as a view-limiting aperture. The main difference is that in the former arrangement sunlight illuminates the precision aperture and reflects the light into the baffle, which in turn produces extra radiation in the cavity as straylight and infrared radiation due to local heating. This effect was confirmed by investigating spare ACRIM and PMO6V radiometers at the TRF. A corresponding re-evaluation of the characterisation of the PMO6V radiometers has been performed which is described in detail in the file, VIRGO_Char2Space.pdf, on our ftp server. The final result of this re-evaluation of the characterisation of the radiometer yields an absolute value of VIRGO TSI which is about 5.8 W.m-2 or 0.42% lower than the original scale.
The datasets, generally updated every 4 months, are available via:
ftp://ftp.pmodwrc.ch/pub/data/irradiance/virgo/TSI/
Note: Several browsers no longer allow ftp addresses to be directly accessed via a link. If you have problems accessing our ftp server, please use an FTP app or try the Astromat website.
All VIRGO data are published under the same doi number: https://doi.org/10.5270/esa-vief1sn
See also: https://archives.esac.esa.int/doi/html/data/heliophysics/soho/VIRGO.html
| Launch | 08:08 UTC, 2 Dec. 1995, Cape Canaveral, USA |
| Launch rocket | Atlas II-AS |
| Orbit | SOHO is operated from a permanent vantage point 1.5 million km sunward of the Earth in a halo orbit around the first Lagrangian point. |
| PMOD/WRC instruments/involvement | PMO6V absolute radiometer and a sunphotometer as part of the VIRGO instrument |
| Dimensions (satellite) | 4.3 x 2.7 x 3.7 m |
| Instrument payload mass | 610 kg |
| Satellite mass at launch | 1850 kg |
Source and credits: ESA, NASA, PMOD/WRC