Overview

Climate change prediction using sophisticated numerical models with a sufficient degree of accuracy is one of the most important issues in modern climate science. Despite the impressive progress in climate modelling during the last 10 – 15 years, many problems with climate models still persist because simulation results are largely determined by the set of the input parameters and boundary conditions which have uncertainties. One of the most ambiguous and least understood is the solar forcing, which is important to quantify and understand the influence of natural forcing on Earth’s climate.

Reconstruction of Solar Forcing

Several reconstructions of historical solar forcing using different approaches have been performed (e.g., Wang et al., 2005; Tapping et al., 2007; Steinhilber et al., 2009; Krivova et al., 2010; Vieira et al., 2011; Shapiro et al., 2011). These studies indicate changes in TSI between the Maunder minimum and the present of 0.1 W.m-2 to 6 W.m-2. No consensus on the amplitude of the solar forcing can be established.

One of the largest increase of the Total Solar Irradiance (TSI) of 6 ± 3 W.m-2  between the Maunder minimum (1645 – 1715) and the Modern Grand Solar Maximum was suggested by Shapiro et al. (2011), implying potentially large effects on Earth’s climate. The results of a solar irradiance reconstruction from Shapiro et al. (2011) were used to simulate climate response to the centennial scale solar irradiance variability (e.g., Anet et al., 2014; Feulner, 2011; Schurer et al., 2014). However, the results did not provide definite conclusions about the reliability of large solar forcing suggested by Shapiro et al. (2011).

The Shapiro et al. (2011) approach was re-evaluated by Judge et al. (2012) who noticed that the solar model for the minimum state of the quiet Sun is too cold and recommended some revision.  Here we address these shortcomings on both, the 11-year and longer time scales, by improving the Shapiro et al. (2011) approach to provide a more reliable reconstruction of solar irradiance variability on decadal to millennial time scales. The main goal  is to present  spectral (from 120 to 100,000 nm) and total solar irradiance time-series from  6000 BCE to the present using an updated model of solar irradiance reconsructions and solar activity proxies such as sunspot number and solar modulation potential retrived from the time-series of cosmogenic radionuclides in ice cores.

Results and Discussions

To obtain secular changes of the spectral solar irradiance on a time-scale from years to millennia, we use the CHRONOS (Code for the High spectral ResolutiOn recoNstructiOn of Solar irradiance) model, which calculates the coverage of the solar surface by different solar structures (sunspots, faculae and quiet Sun) and combines their spectra.

CHRONOS is a new version of the model used by Shapiro et al. (2011) with updated treatment of the filling factors and long-term variability of the quiet Sun irradiance. The implemented improvements allow the efficiency of the code and the accuracy of the solar irradiance calculations to be increased. CHRONOS is based on the new spectral synthesis code, NESSY (NLTE Spectral SYnthesis), reported by Tagirov et al., 2017.

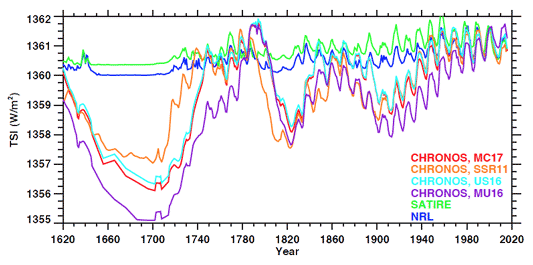
Figure 1. Temporal evolution of the Total Solar Irradiance (TSI) calculated with CHRONOS using different solar modulation potentials in comparison with other model outputs.

The TSI time-series reconstructed by CHRONOS, SATIRE and NRLSSI2 models are shown in Figure 1 in absolute values for the period 1620 – 2015. The CHRONOS results are represented by four curves, calculated using four solar modulation potential datasets. All four reconstructions exhibit an overall agreement with respect to periods of lower solar activity during the Maunder, Dalton, and Gleisberg minima, as well as the period of high and persistent TSI from 1940 until 2002 (the modern Grand Maximum). The TSI increase from the Maunder minimum to 2008 in the CHRONOS models is much higher than for the NRLSSI2 and SATIRE results for all solar modulation potential versions because the evolution of the quiet Sun’s irradiance is treated differently. The amplitude of the CHRONOS reconstruction is nearly 5 W.m-2, which is lower than a value of 6 W.m-2 suggested by Shapiro et al. (2011) as a mean estimate. The change of the amplitude in TSI variability with respect to the version by Shapiro et al. (2011) is explained by the use of the slightly warmer atmospheric structure Model B in combination with the use of new solar modulation potentials.

Conclusions

The performance of the CHRONOS model during the satellite period is comparable to other solar irradiance reconstructions dedicated to the present that use a more sophisticated treatment of the solar active regions. Using the updated model and new proxy data for the solar modulation potential we suggest a multi-centennial solar forcing whose magnitude is 25 – 40% smaller than that proposed by Shapiro et al. (2011), but still significantly higher than the results of other groups.

On a multi-millennial time-scale, the TSI time-series, reconstructed using different solar modulation potentials, are mostly in good agreement except for certain periods (e.g., 3200 – 0  BCE). They unanimously point to the lowest TSI value around 1450 CE and highest TSI (exceeding 6 W.m-2) which appears between 200 and 500 CE. Overall, the magnitude of the TSI and SSI variabilities on a millenial time-scale is similar or slightly higher than during the past 400 years CE. The uncertainty of our TSI and SSI reconstructions is substantial. The use of different solar modulation potential data sets already yield an uncertainty of almost a factor of two as illustrated in Figure 1.

The reconstructed SSI data sets, corresponding to the three solar modulation potentials that have been used as an input to CHRONOS, are available upon request.

References

Egorova T. et al., (2018), Revised historical solar irradiance forcing, A&A, 615, A85, doi: 10.1051/0004-6361/201731199
Shapiro A. et al., (2011), A new approach to the long-term reconstruction of the solar irradiance leads to large historical solar forcing, Astron. Astrophys, 529, A67, doi: 10.1051/0004-6361/201016173
Tagirov R. et al., (2017), NESSY: NLTE spectral synthesis code for solar and stellar atmospheres, Astron. Astrophys, 603, A27, doi: 10.1051/0004-6361/201628574
For further information please contact: Dr. T. Egorova