1. Scientific Objectives
The scientific objective of the VIRGO experiment (Variability of solar IRradiance and Gravity Oscillations) is to determine the characteristics of pressure and internal gravity oscillations by observing irradiance and radiance variations, to measure the solar total and spectral irradiance and to quantify their variability over periods of days to the duration of the mission. With these data helioseismological methods can be used to probe the solar interior.
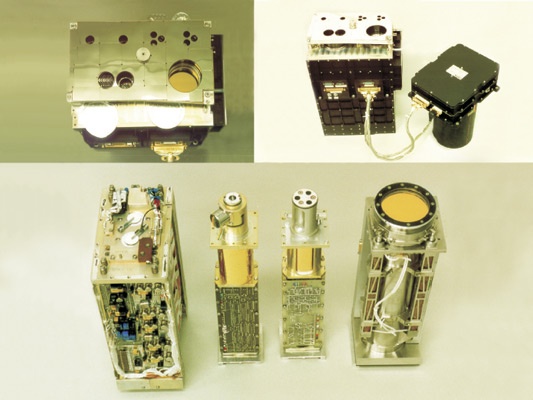
The VIRGO experiment on the ESA/NASA SOHO Mission has three types of instruments to measure total solar irradiance (TSI) with the absolute radiometers DIARAD and PMO6V, spectral solar irradiance at 402, 500 and 862 nm with a 3-channel sun photometer (SPM) and spectral radiance at 500 nm with a Luminosity Oscillation Imager (LOI).
The optical system of the VIRGO assembly consists of a Ritchey-Chrétien type telescope with a 1300 mm focal length, diameter of 55 mm, and central obstruction 25 mm. The detector is a deep diffused silicon photodiode with 12 scientific and four guiding pixels.
- PMO6V (PMOD/WRC), is an active cavity radiometer (absolute instrument) measuring continuously the degradation of the active instrument. Some parameter specifications are: life variation: 30 ppm/year, absolute accuracy: 0.17%, sampling rate: 1 solar total irradiance/2 minutes, duty cycle: 17%, resolution: 50 ppm.
- DIARAD (Differential Absolute Radiometer, IRMB, Belgium) is an active cavity radiometer. It is composed of two cylindrical cavities coated inside with diffuse black and mounted next to each other on the same heat sink. Some parameter specifications are: lifetime variation: 30 ppm/year, absolute calibration: 0.15%, sampling rate: 1 solar total irradiance/3 minutes, duty cycle: 11%.
- SPM (Sunphotometer, PMOD/WRC). There are two instruments to measure to measure the spectral irradiance at 335, 500, and 865 nm with a bandwidth of 5 nm.
- LOI (Luminosity Oscillations Imager, ESA) measures variations in the sun’s diameter with a precision of about 0.3 arcsec for a 1.5 hour integration time. The LOI wavelength and bandpass is chosen to be the same as the 500 nm channel of SPM. This allows the instruments to be calibrated to each other.
The Total Solar Irradiance (TSI) is being observed with active cavity radiometers (PMO6 and DIARAD) which are traceable to the SI scale of irradiance through direct comparison with cryogenic radiometers on the ground and in vacuum for the PMO6, and thorough characterization in the laboratory for the DIARAD. SSI (Spectral Solar Irradiance) measurements are carried out by SPM (Sunphotometers).
VIRGO provides:
- Continuous high-precision, high-stability and high-accuracy measurements of variations in TSI and SSI.
- Frequencies, amplitudes and phases of oscillation modes in the frequency range from 0.001 to 8 mHz.
These data will be utilised to achieve the main scientific objectives of VIRGO, summarised in the following list:
- Detect and classify low-degree G-modes of solar oscillations.
- Determine the sound speed, density stratification and rotation in the solar interior, specifically determine the physical and dynamical properties of the solar core.
- Study the solar atmosphere through comparison of amplitudes and phases of the p-modes with those from velocity observations e.g. GOLF, SOI/MDI.
- Search for the long periodicities or quasi-periodicities that have been found in other solar parameters.
- Utilise the solar “noise” signal to develop models for the global signature of stellar surface parameters.
- Determine properties of the solar asphericity and its variation in time.
- Study the relation between p-mode frequency changes and irradiance variations.
- Study the influence of solar active regions and other large-scale structures on TSI and SSI.
- Study the solar energy budget.
- Provide accurate TSI and SSI data for input in terrestrial climate models.
2. VIRGO Data
Data Products and Evaluation
All VIRGO data are sent after reception on ground to the VIRGO Data Center which is operated by and located at the Instituto Astrofisica de Canarias in La Laguna on Tenerife. After reception the raw data are separated into instrument files forming the level-0 data sets organised in daily files. During this process possible gaps in the science data due to transmission problems are filled from the 12 and 24-hour delayed data packets, which are stored onboard and transmitted together with real-time packets. Level-1 data are those that have been converted to physical units; they include the calibrations and contain all the corrections known a priori for instrument-related effects, such as the influence of temperature variation. The signals are also reduced to 1 AU distance and to zero radial velocity. The processing is based on the algorithms developed and maintained by the CoI responsible for the instrument concerned (Instrument CoIs: Th.Appourchaux for LOI, Seven Dewitte (D. Crommelynck until 1998) for DIARAD, I. Ruedi (J.Romero and M. Anklin until 1996 and 1999, respectively) for PMO6V and C. Wehrli for SPM). These Level-1 data are publically available at the SOHO archive and are still raw in the sense that they do not contain corrections for, e.g. degradation, which can be calculated only from a posteriori analysis.
In a next step, corrections for exposure and non-exposure dependent changes have to be determined. In the case of TSI, the former ones can be deduced for each radiometer individually and yields two level-1.8 time-series, whereas the latter is only accessible by comparison of the two. A combination of the two yields then the final VIRGO total solar irradiance (TSI) as explained in the below VIRGO radiometry section. For the SPM data a similar procedure for the correction of the degradation is not possible, mainly because these instruments have much larger overall changes and the results from the rarely exposed back-up SPM do not provide a reliable source for the assessment of the long-term changes. Nevertheless the time-series can be detrended and allow to assess periods of up to 1 year; they are labelled as level-2. These data (level-1.8 and 2) are available from our ftp server as described below.
Description and Availability of Level-1 Data Products
The level-1 data are organised in daily FITS files with the data in ASCII extensions. The data and format are described in the corresponding headers. As it is a standard FITS format, the files can be read with the FITS library for the programming language you use. An example of the FITS headers of SPM, DIARAD, PMO6V and LOI files for 1 January 2003 can be retrieved as FITS_Headers.txt from our ftp server; and there is also a collection of IDL routines for reading the VIRGO daily FITS files. The SPM, PMO6V and LOI data are 1-minute samples (1440 values per day) and the DIARAD data 3-minute samples (480 values per day). As MDI and GOLF, VIRGO should have had its one-minute values centered at 00:00:00 TAI; but early in the mission the midnight pulse which is used by VIRGO for synchronzation of the timing chain was set to 00:00:00 UTC instead of TAI, which yields a delay of 32 seconds (the sum of leap seconds since start of TAI). Thus the 1-minute averages of SPM and LOI are centered at 32s after the TAI minute (first measurement @ 00:00:32 TAI). The 20s averages of PMO6V every minute are centered at 22s after the TAI minute (1st measurment @ 00:00:18 TAI) and the 10s averages of DIARAD every 3 min at 87 s after the start of a 3 min period (first measurement @ 00:00:87 TAI).
From the data files the following information is retrieved by the IDL routines:
- yymmdd_1.P00: 1440 values of PMO6V-A TSI in Wm-2 and a quality flag as 8-bit unsigned integer with the following meaning of the bit values: 64: cover closed; 32: SOHO off-pointing; 16: DIARAD calibration on (increases the noise of PMO6V-A, TSI values could be outliers), 8: period between reference values is more than the nominal 8 hours, values are less reliable, 4: smoothness condition failed, values are less reliable; 2: some temperatures from the HK packets are missing, values interpolated and essentially no problem for the data quality; 1: no distance correction.
- yymmdd_1.D01: 480 values of DIARAD-L TSI in Wm-2 . The quality flag is not read as it contains status information and not the quality, the quality is reflected is either good if a value of TSI is available or bad if the value returned is NaN.
- yymmdd_1.S02: 1440 values of the red, green and blue channels in Wm-2nm-1 and one quality flag as 3-bit unsigned integer with the following meaning of the bit values: 4: no depointing correction could be applied (because of lack of the corresponding ancillary S/C data, this bit is always set, and the de-pointing angle set to zero); 2: no distance correction could be applied; 1: no temperature correction could be applied.
- yymmdd_1.L00: 1440 values of the 12 main pixels (microamp) with one quality flag, 4 guiding pixels (microamp) with one quality flag, and the EW and NS diameter in arcmin. The quality flag is given as ascii ‘GOOD’ or ‘POOR’. The following figure identifies the numbering for the LOI pixels.
The level-1 data products are normally updated on a weekly basis and transferred from VDC to the SOHO archive, from where they can be downloaded.
Description and Availability of Level-1.8 and 2 Data Products
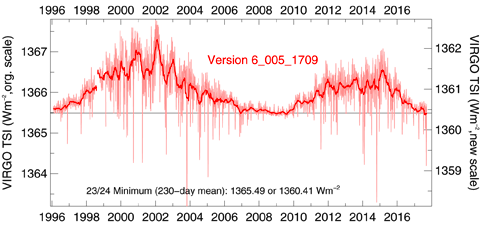
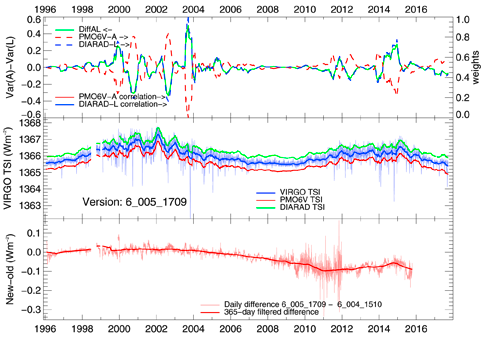
The level 2 TSI time-series for VIRGO, PMO6V and DIARAD are available as hourly and daily values. For a detailed description of the evaluation see VIRGO Radiometry below. Note that since version 5_005 the date of the update is added to the version. Since version 6_000 the algorithms for the evaluation have changed for the PMO6V evaluation from level 1 to 1.8 and for the corrections of DIARAD level 1.8 to 2.0. Since version 6_004 a new algorithm has been used to produce the level 2.0 from level 1.0 data. The actual VIRGO TSI is shown in Figure 2.1 which is also part of the TSI composite.
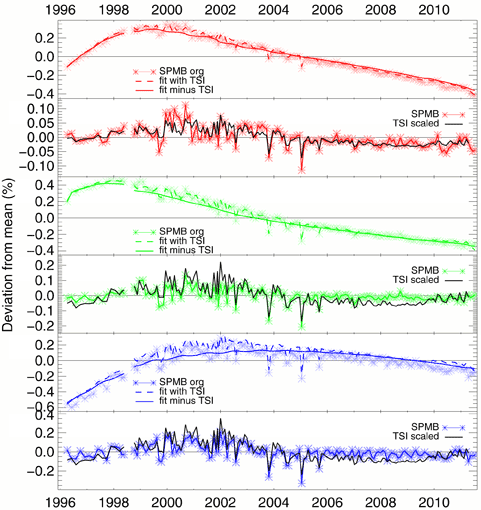
The level-2 SPM data are also available as hourly and daily values. The actual time-series for the red, green and blue channels are plotted in Figure 2.2 together with TSI detrended using the same polynomials.
Description and Availability of Data Products for Helioseismic Studies
Detrended and cleaned 1-minute time-series for helioseismic studies are available for the SPM red, green and blue channels, the PMO6V TSI and the 12 pixels of LOI as IDL save files. The SPM and LOI time-series are detrended with a triangular filter with a 2-day base. The PMO6A time-series is corrected for degradation (with the corresponding correction table ) and gaps shorter than 8 hours are filled with ARIMA extrapolations from both sides. These time-series span somewhat different periods and are updated sporadically.
3. VIRGO Radiometry and Determination of TSI
From Raw Measurements to a Reliable Record of Total Solar Irradiance (TSI)
The VIRGO Experiment has two types of radiometers to measure total solar irradiance (TSI): DIARAD and PMO6V. The former has been developed and built by IRMB, the latter by PMOD/WRC. For the VIRGO radiometers detailed descriptions of the principle and performance can be found in Fröhlich et al. (1995), Fröhlich et al. (1997). The scientific objective of VIRGO related the total solar irradiance, as stated in the original proposal and in Fröhlich et al. (1995), is to provide a reliable time-series of TSI, which takes full advantage of both types of radiometers and their backup. This final product – the data level-2 – includes corrections for changes due to exposure to the Sun and other effects. The analysis of the data up to level-2 is now at version 6.4 and described in some detail in an aide-memoire VIRGO_TSI-vers64.pdf and summarised in the following.
From Level-0 to Level-1
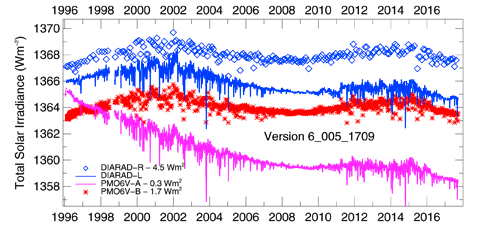
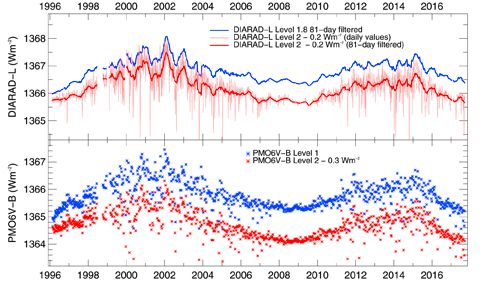
The raw data (level-0) as transmitted from the spacecraft to ground are transformed into physical units using the radiometric factor which is determined for each individual radiometer by characterisation experiments in the laboratory. Furthermore corrections for all a-priory known effects, are applied such as temperature, distance and radial velocity to the Sun. These data are labelled level-1. The algorithms for the calculation of level-1 data were developed by IRMB for DIARAD and by PMOD/WRC for the PMO6V radiometers. The original algorithms are described in Fröhlich et al. (1997) which are still being changed to cope with changes in operation and with the better understanding of their performance. Figure 3.1 shows the result for the present version, updated to YYMM, the date in the filename. These time-series obviously do not show the variations of the solar irradiance alone, but also changes of the radiometric sensitivity which are quite different for the two types radiometers. It is also obvious that DIARAD shows less sensitivity changes than PMO6V and it is interesting to note that the decrease of sensitivity, normally termed as degradation, corresponds almost exactly to the one observed during the EURECA mission. In contrast DIARAD, which flew also on EURECA shows on SOHO much less change than then.
From Level-1 to Level-2
The early behaviour of PMO6V is characterised by a rapid increase which is the result of a rapid darkening of the precision aperture surface which reduces the amount of stray-light from the baffle. The darkening is known since the apertures of the retrieved SOVA radiometer of the EURECA mission were inspected but the early increase was thought to be due to a change of the aperture heating. This, however, can never explain the effect and stray-light and IR radiation from the heated baffle back to the cavity is of the order of more than 3000 ppm which can explain the early increase and also the high absolute values of TSI relative to TIM on SORCE. This effect is observed in most of the radiometer with the classical arrangement of the precison and view-limiting apertures as HF, ERBS and ACRIMs and so also their high absolute values. DIARAD does not show an early increase, mainly because the precision aperture is highly polished, electrolytically coated with nickel and curved to provide an image of the sun in the center of the view-limiting aperture, which avoids stray-light completely. So the high absolute value of DIARAD needs another explation and the reason was found in a substantially larger area covered by the electrical heater relative to the illuminated area which also reduces the absolute value by about 3000 ppm. The revised characterisation of both radiometers is described in VIRGO_Char2Space.pdf.
The new evaluation is no longer based on the straightforward correction of the PMO6V and DIARAD by their backup because PMO6V-B needs to be corrected for its early increase before it can be used to correct PMO6V-A. So, we start with the correction DIARAD-L by R and then compare the corrected DIARAD with PMO6V-B by fitting an exponential correction for the non-exposure dependent change of DIARAD and a dose and temperature dependent correction for the early increase of PMO6V-B simultaneously. This yields a fully corrected DIARAD-L which corresponds to the final level-2 and a corrected PMO6V-B which can now be used to correct PMO6V-A to level-2. In the following the different steps are illustrated.
Figure 3.3. The top panel shows the difference between the corrected DIARAD and PMO6V-B and the fit with two parameters for the exponential function of DIARAD, one parameter for the step over the gap and eight parameters for PMO6V-B (Eq.11 of VIRGO_TSI-vers64.pdf). The middle panel shows the the comparison with ACRIM-I and bottom panel the final result. Note, the zero change of PMO6V-B over the SOHO vacations.
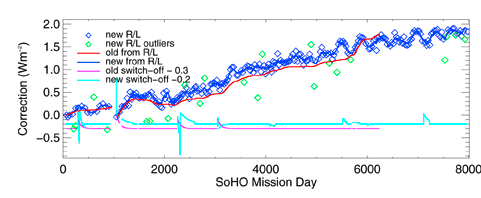
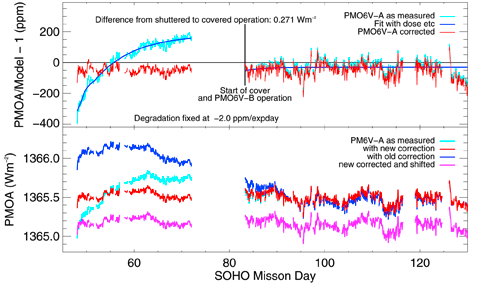
The first step is the comparison of DIARAD-L with the backup R, illustrated in Figure 3.2. In contrast to earlier versions the interpolation of the monthly values of DIARAD L/R is now done with splines which reveals more details and shows that also the DIARAD degradation shows a temperature dependence with its annual variation on SOHO. The correction is fundmentally different from Crommelynck et al. (2004) and the IRMB/DIARAD page). DIARAD needs also a few other corrections due to switch-off of VIRGO. They have been re-determined and showed also slips and the first observed exponential recovery is not always found after later switch-off. Now we have a corrected DIARAD which can be compared to PMO6V-B as shown in the top panel of Figure 3.3 together with the fitted curve which is based on an exponential function for DIARAD and a dose and temperature dependent increase for PMO6V-B. Then the change over the SOHO vacations is determined by comparison with ACRIM-I during 500 days (middle panel). If the so determined difference is applied, it turns out that the full difference is due to DIARAD. A posteriori, we can now assume that the PMO6V-B does not change its sensitivity over the SOHO vacations as shown in the bottom panel. Figure 3.4 shows the comparison of the original and corrected time-series. Before we can use the corrected PMO6V-B to correct PMO6V-A we need to correct PMO6V-A for the early increase. The main part of the increase is during the shuttered operation which provides a reference to the original absolute calibration and later the change in calibration due the change in operation. For this early increase correction we need TSI values to compare with. As DIARAD starts at mission day 68 only, we expand these data with the proxy model to mission day 48. The result is shown in Figure 3.5.
Figure 3.5. Top panel: Ratio of the irradiance of PMO6V-A to a combination of the proxy model and DIARAD, which starts only at 7 February 1996. Apart from the correction due to the early increase, the change of absolute values due to change from shuttered to covered operation is also determined. Bottom panel: Corrected PMO6V-A values with new “corrections” compared to the former ones as with old “corrections”. Also shown are the shifted values as used in the further analysis which refer the absolute values to the first-light value.
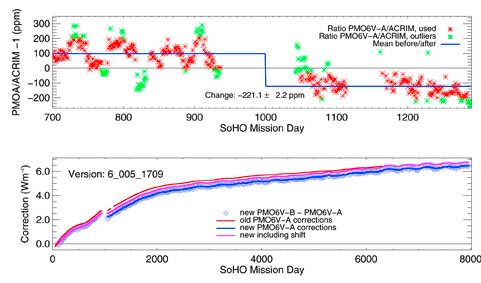
With the level-2 PMO6V-B series the corrections for PMO6V-A can now be determined over the whole mission and interpolated by the method of splines to the hourly values as shown in Figure 3.6 (bottom panel) and the change over the SoHO interruption is determined by comparison with ACRIM (top panel). Again, the PMO6V-A has not changed during SOHO vacations similar to PMO6V-B and we could indeed do the analysis without using ACRIM-I for comparison.
VIRGO TSI is defined as the average of the PMO6V and DIARAD values and is determined by weighting. The weights are deduced from the difference of the variances of PMO6V minus the one of DIARAD, each determined from a 81-day-running period and shown by the green line on the top panel of Figure 3.7, smoothed with a 131-day boxcar. It is normalised in such a way that the absolute maximum is set to 0.5 and a positive difference means that the noise of PMO6V is higher and its weight correspondingly lower and a negative one that the noise of DIARAD is higher. So, weights from 0…1 are shown as red and blue dashed lines (with the left scale). On the other hand, DIARAD has in general less noise than PMO6V with e.g. the spikes during the keyholes due to the fact that still the original level-0 to 1 algorithm. For the moment, it seemed more important to have an internally consistent way to produce the level-2 data, than improving on the noise of PMO6V. The new evaluation of level-0 to 1 is under way and will be available in due time.
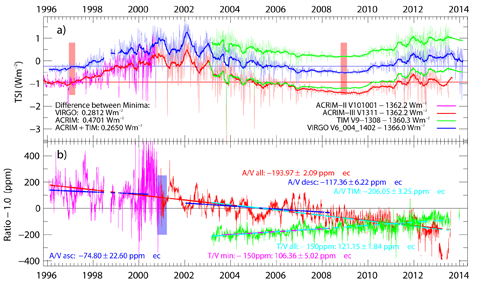
Figure 3.8. VIRGO TSI (original scale) is compared to ACRIM and TIM. The ACRIM values are on the scale of ACRIM,3 (version 1311). It is interesting to note that the slope of VIRGO relative to ACRIM for the whole period and for the TIM period are similar although the time-series is composed of ACRIM,2 and 3.
This leads to the final VIRGO TSI record as hourly and daily TSI values. These data files have a similar format as before, the first TSI column is now VIRGO TSI on the new absolute scale (see next Section) and the others as before the VIRGO, PMO6V and DIARAD TSI values on the original scale. Please note that we have not changed the version, because a scale change is only a factor and not related to the way the data are analysed.
Now we can compare the VIRGO TSI with ACRIM-3 and TIM as shown in Figure 3.8. Besides the absolute value, the major results can be summarised as follows:
(i) Relative to TIM VIRGO TSI has a downward trend of 13.1 +/- 1.9 ppm/a corresponding to a difference of about 150 ppm over a solar cycle.
(ii) Relative to ACRIM-3 VIRGO TSI has during the period of TIM an upward trend of 20.2 +/- 1.9 ppm/a.
(iii) VIRGO TSI has still the artefact during the keyholes of SOHO which are coming from the PMO6V data due to some inadequate temperature interpolation of missing values in the present level0 to 1 evaluation. In general the PMO6V values have less medium- to long-term deviations relative to TIM than DIARAD, but the noise of PMO6V is higher.
If you want to use the 1-min data of PMO6V or the 3-min data for DIARAD, you can fetch them from the SOHO archive and then you can use the correction table to get the level-2 product. The file may also be taken from ftp://ftp.pmodwrc.ch/pub/data/irradiance/virgo/1-minute_Data/VIRGO_1min_0083-7404.fits, updated until April 2016.
Revised Characterisation and New Absolute Value of TSI

